How to Display Survey Results
Adding visual representation (pie chart, column chart, or table) of webform results for surveys.
A: General Information & Setup
- There are three Survey form templates (basic, medium, complex) that should be duplicated for new Project surveys
- You can find the survey templates under Structure > Webforms
- It is advisable to name the Survey (webform) using this pattern "Survey - {{ project title }}"
- Each Survey has confirmation settings preset to best comply with adding result analysis displays on the Survey's confirmation page.
- The confirmation Page URL is generated by the system and will be
/node/#/webform/confirmationwhere # = webform ID. - To confirm this URL, simply attach the form to a "Project" and submit a test submission from the Project's page. Copy the resulting confirmation URL. You will need this when placing Webform Analysis blocks.
- For example, you will need the bolded portion of the submission confirmation URL. Example: https://demo.engage.civikit.com/node/71/webform/confirmation
- Do not include anything after and including the
?of the token part of the URL. (ie. ?token=DFNIBz801....)
- Do not include anything after and including the
- The confirmation Page URL is generated by the system and will be
B: Add Survey Result Blocks to Confirmation Page
- You will need to know the confirmation URL from the instructions above.
- In this document, we'll use an example webform confirmation url.
/node/67/webform/confirmation
- In this document, we'll use an example webform confirmation url.
- Go to the Block layout manager: Structure ➝ Block layout
- Scroll down to the Content block region and select Place block
Image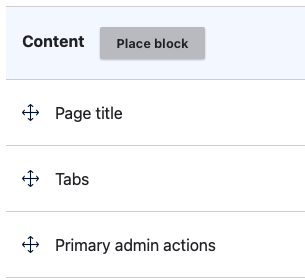
- Type "Webform Analysis" to find the type of block you are going to place.
- Select Place block from the one result in the list
Image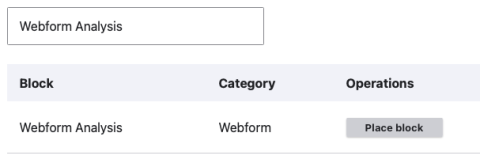
- Update the required "Title field" to include the Survey Title and Component (question title) (Ex: Community Garden - location question)
- Uncheck "Display title"
- Select the webform for the Survey that you want to add analysis charts for on the confirmation results page.
- In the Component field, select the question you would like to display.
- *You will need to add a block for each question for which you'd like to display an analysis chart.
- In the Chart type field, select Pie, Column or Table. (see example below for a visual representation)
- Under the Visibility options, click on Pages if not already active.
Image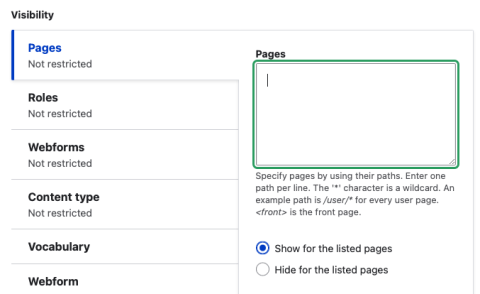
- In the Pages field, enter the confirmation page URL from B.1.a, include the forward slash as directed by the field's help text:
/node/67/webform/confirmation
Image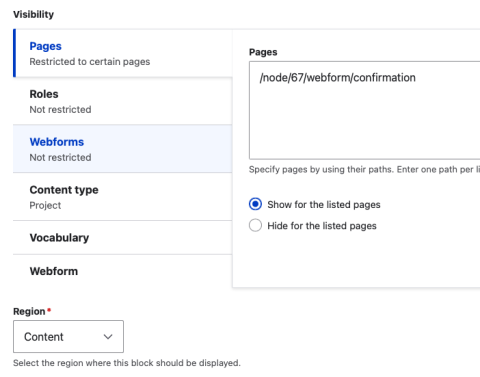
- Ensure the radio button for "Show for the listed pages" is selected below the field.
- Ensure the Region is set to Content.
- Select Save to complete
- Repeat for other suitable questions in the Survey webform.
- Submit another test submission to confirm it works as intended.
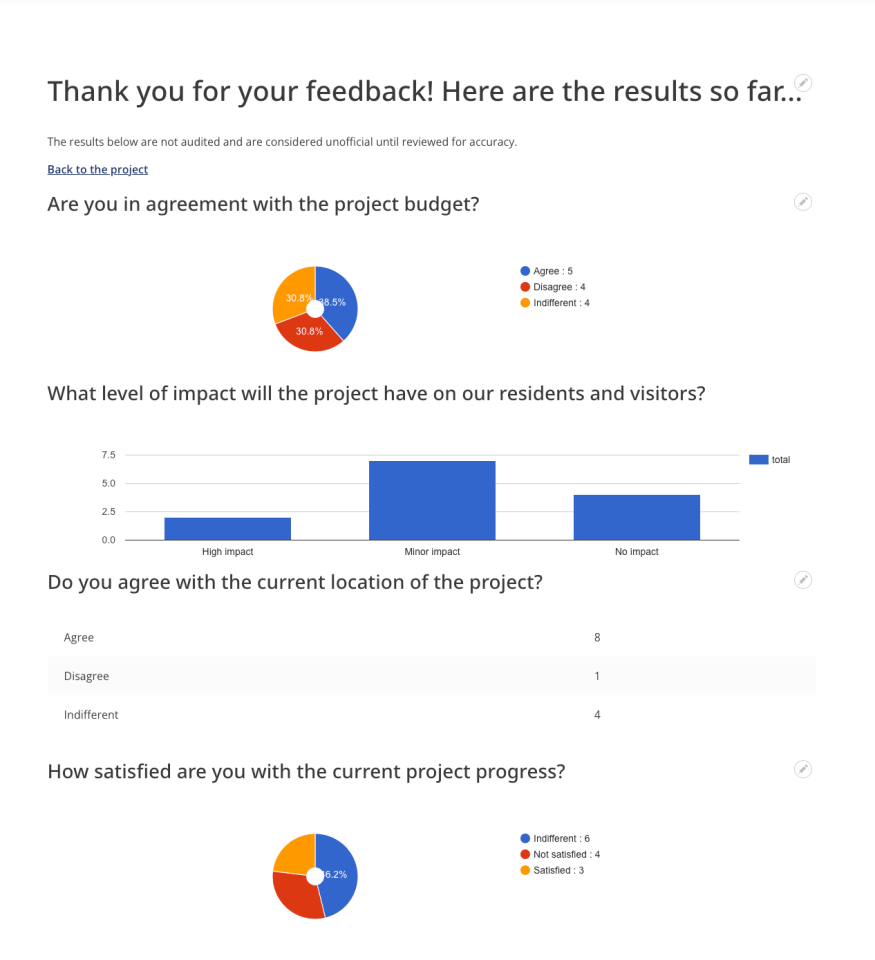
The example below shows results in all graphics available; pie chart, columns and tables.
Image